Data analysis
Predicting NBA Playoff Teams, Wins, and Champions
Can a team's regular-season stats tell you whether it will make the playoffs, how many games it will win, or whether it will win the title? For BUAL 5610, a team of three built and compared three machine learning models in Python to find out, and to see which ones were reliable enough to use.
The problem
NBA teams want to know which stats actually drive winning, and sports betting companies need reliable forecasts to set lines. We tested how well regular-season team stats predict three outcomes.
Audience: NBA front offices and sports betting companies
Objectives
- Forecast which teams make the playoffs
- Predict each team's total regular-season wins
- Predict the NBA champion
Constraints
- Injuries, trades, and coaching changes are not in the data
- The COVID-shortened 2019 to 2021 seasons had unequal games played
What I did
- Built predictive models in Python to forecast NBA team performance from historical team stats
Results
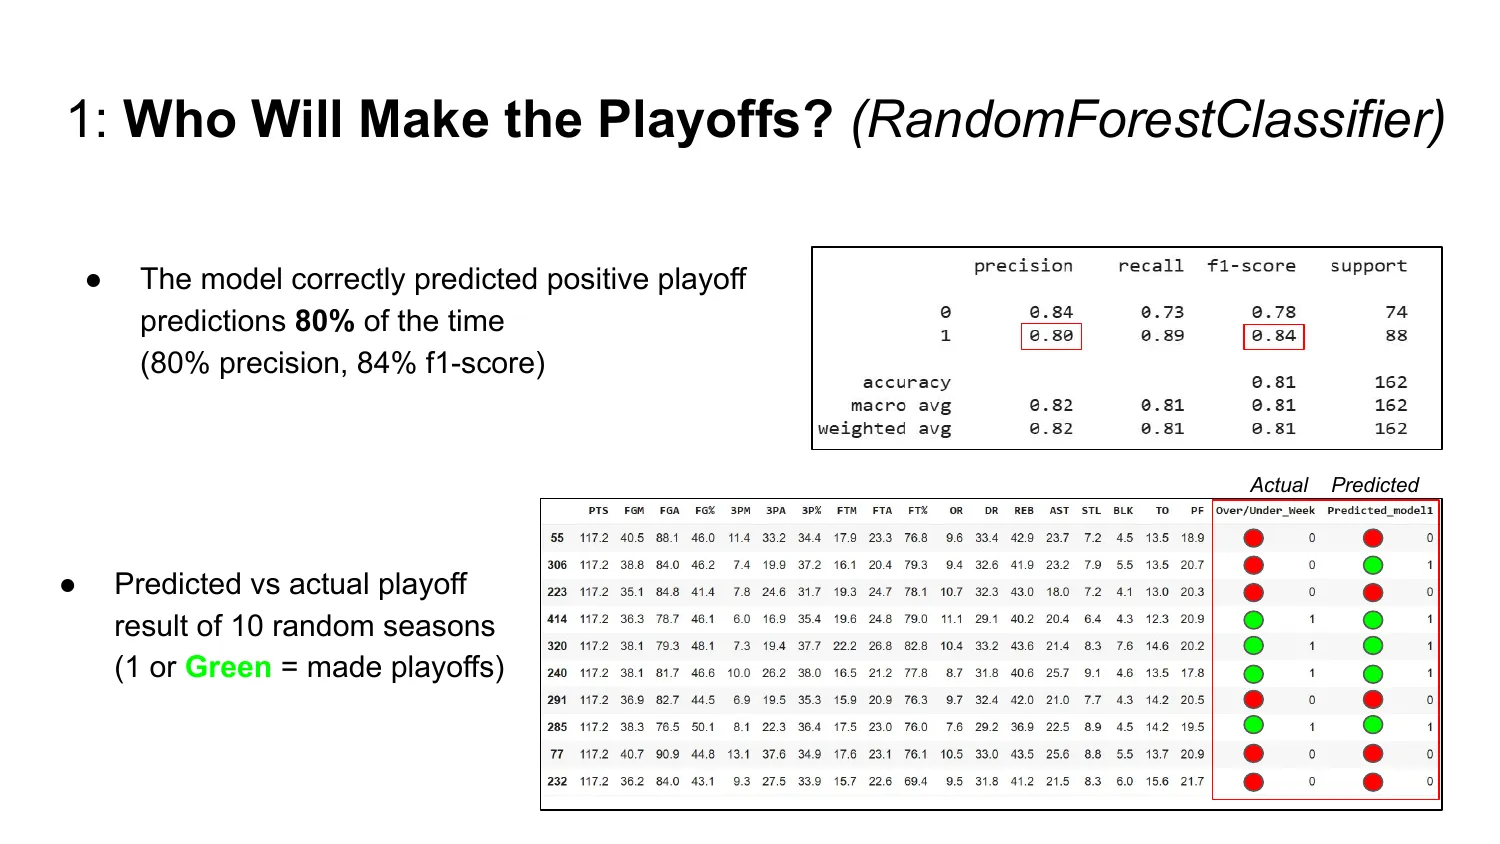
- Playoff model (random forest): 80% precision and a 0.84 F1 score on 162 held-out team-seasonsClassification report in the project notebook and final presentation
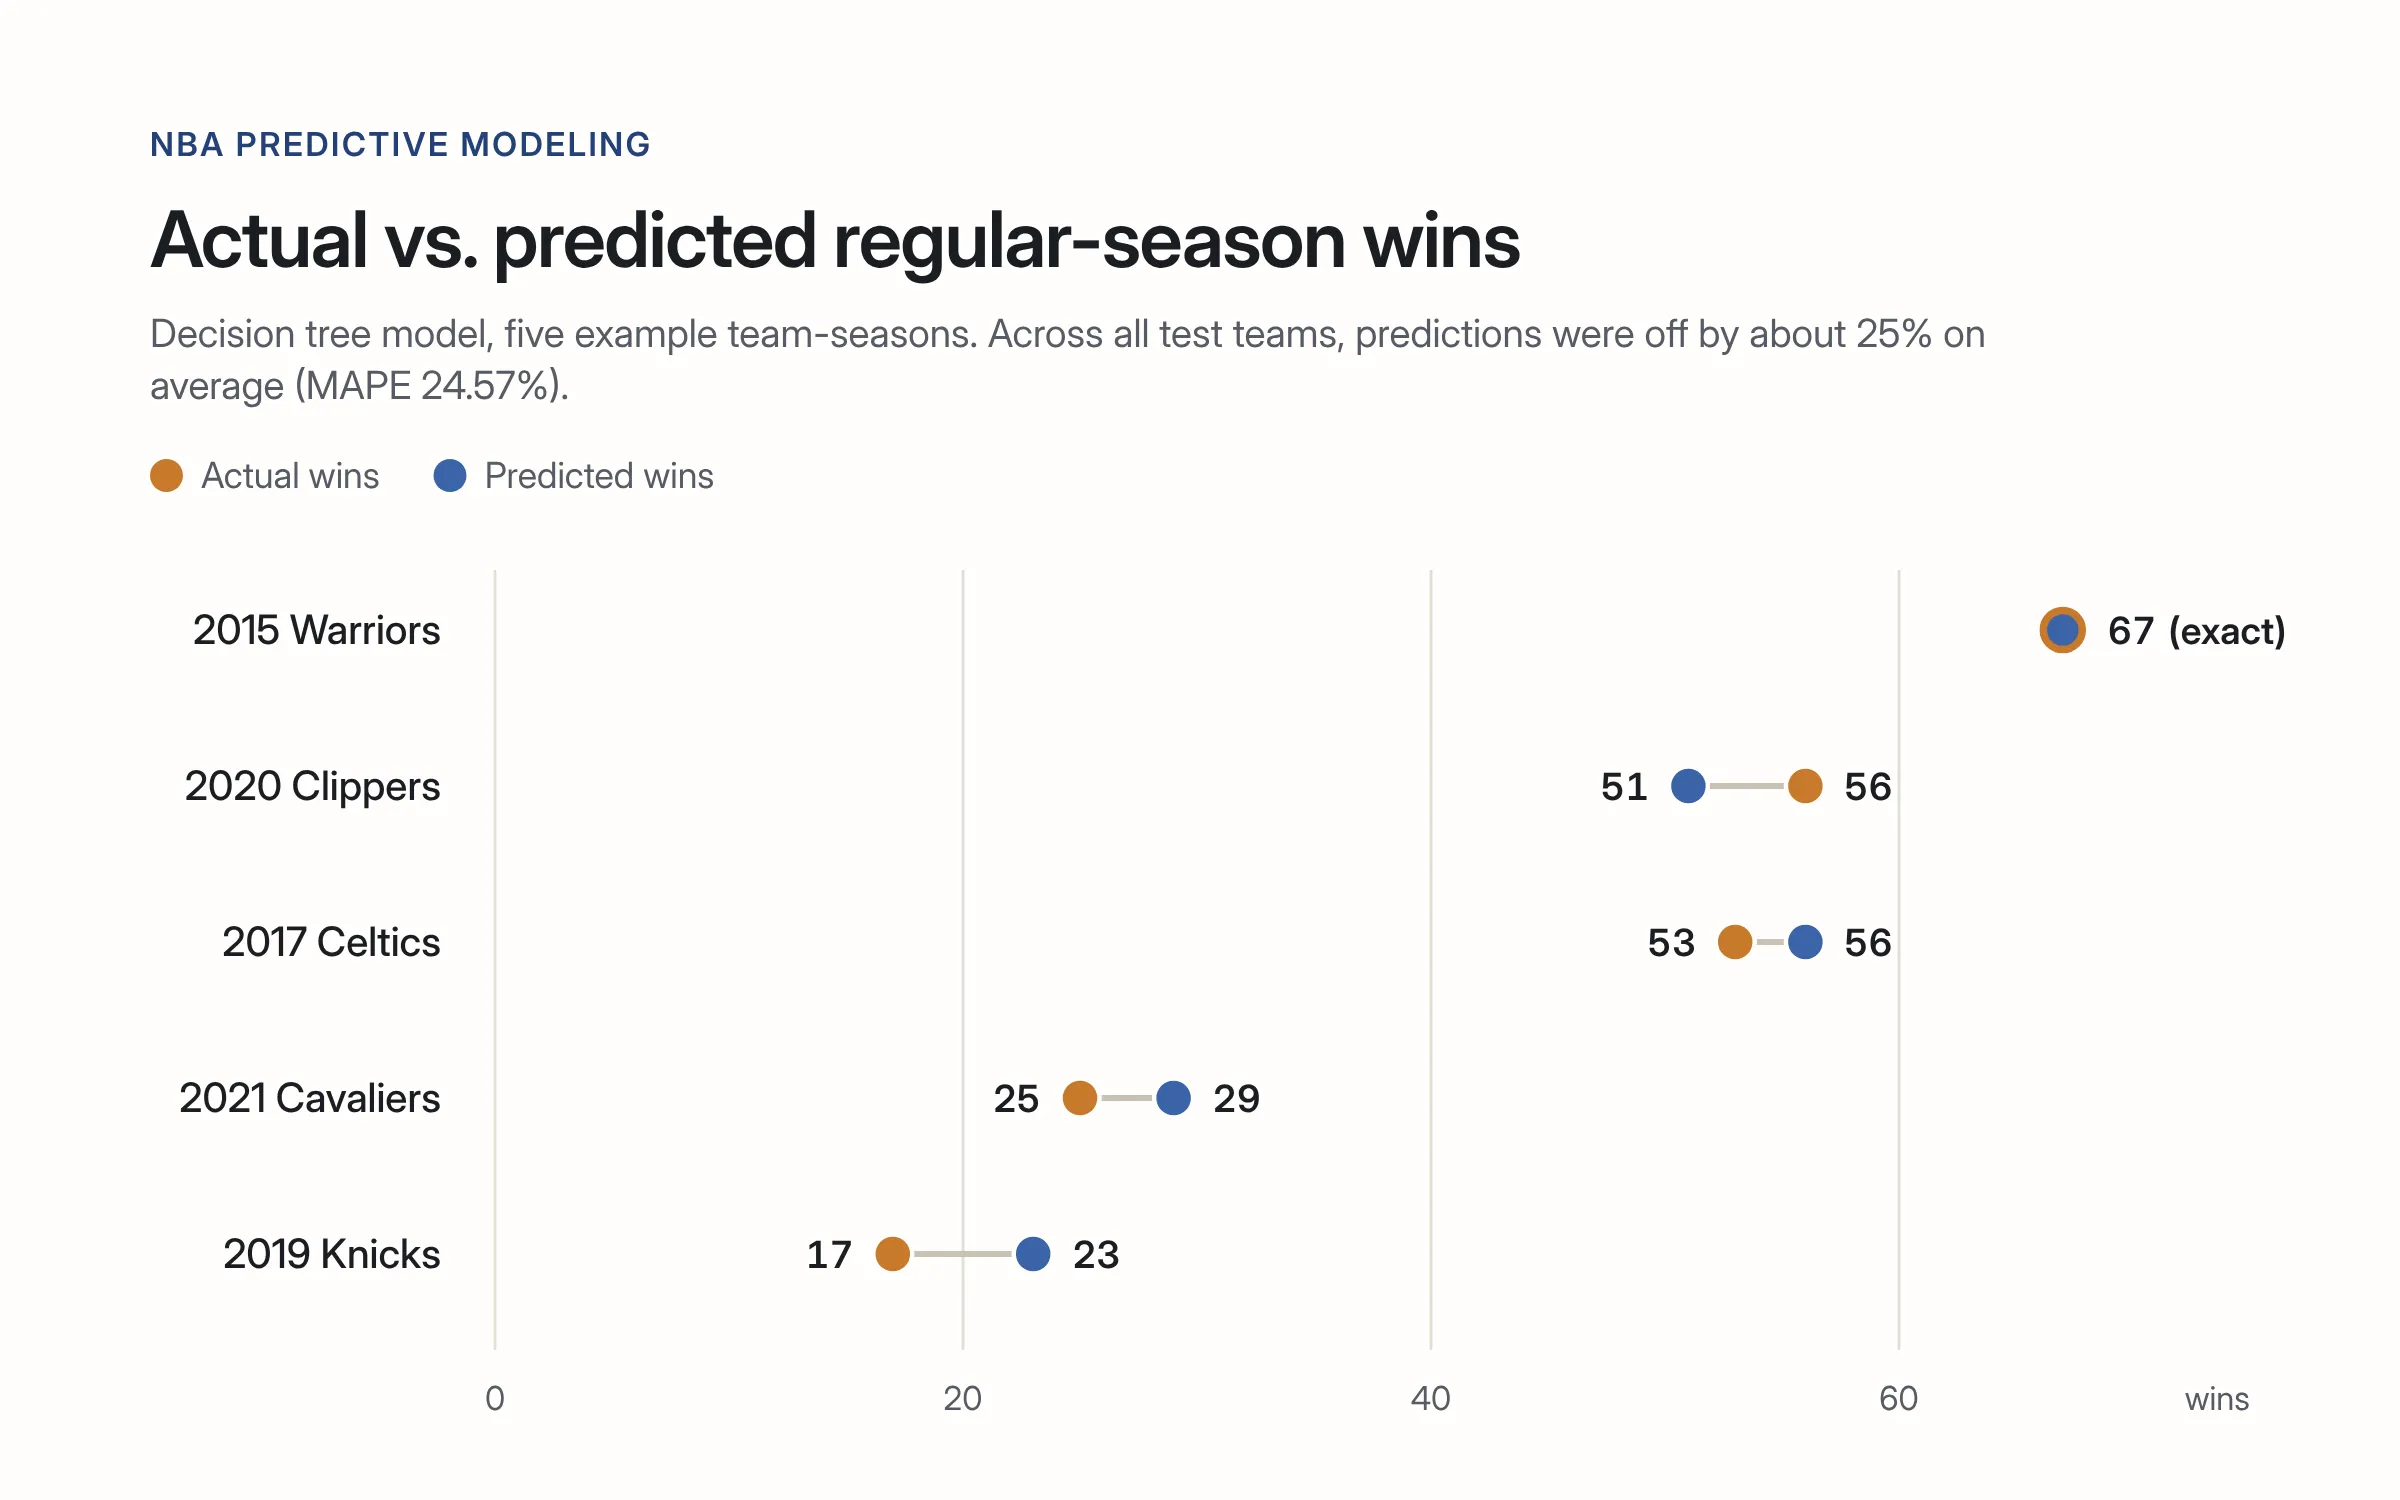
- Season-wins model (decision tree): predictions off by about 25% on average (MAPE 24.57%), and most accurate for the best and worst teamsFinal presentation and project notebook
- Championship model (support vector classifier): 29% precision, versus about 6% for picking one of 16 playoff teams at randomClassification report in the project notebook and final presentation
The question
Teams, analysts, and sportsbooks all try to forecast the NBA season from numbers. We wanted to know how far team stats alone can take you, and which of three questions they answer best: who makes the playoffs, how many games each team wins, and who wins it all.
The data
We used per-game team statistics for every team from 2005 to 2023, from a public Kaggle dataset: 540 team-seasons covering points, shooting percentages, rebounds, assists, steals, blocks, turnovers, and more. Each stat became a predictor. The targets were playoff qualification, games won, and the championship.
Two choices shaped everything that followed:
- Only use what you would know in time. We removed identifiers like season and team name, plus any outcome that would not be known when the prediction is made. Leaving those in would let a model “cheat” by seeing part of the answer.
- Pick the metric that matches the decision. For the playoff and championship models we focused on precision: when the model says yes, how often is it right? For the wins model we used mean absolute percentage error (MAPE), which reads as “off by this much, on average.”
Three questions, three models
The playoff model was the one worth using
A random forest classifier (200 trees) predicted playoff qualification with 80% precision and a 0.84 F1 score on a held-out test set of 162 team-seasons. It is accurate enough to tell whether a team’s current stats put it on a playoff track.
Win totals were easiest to call at the extremes
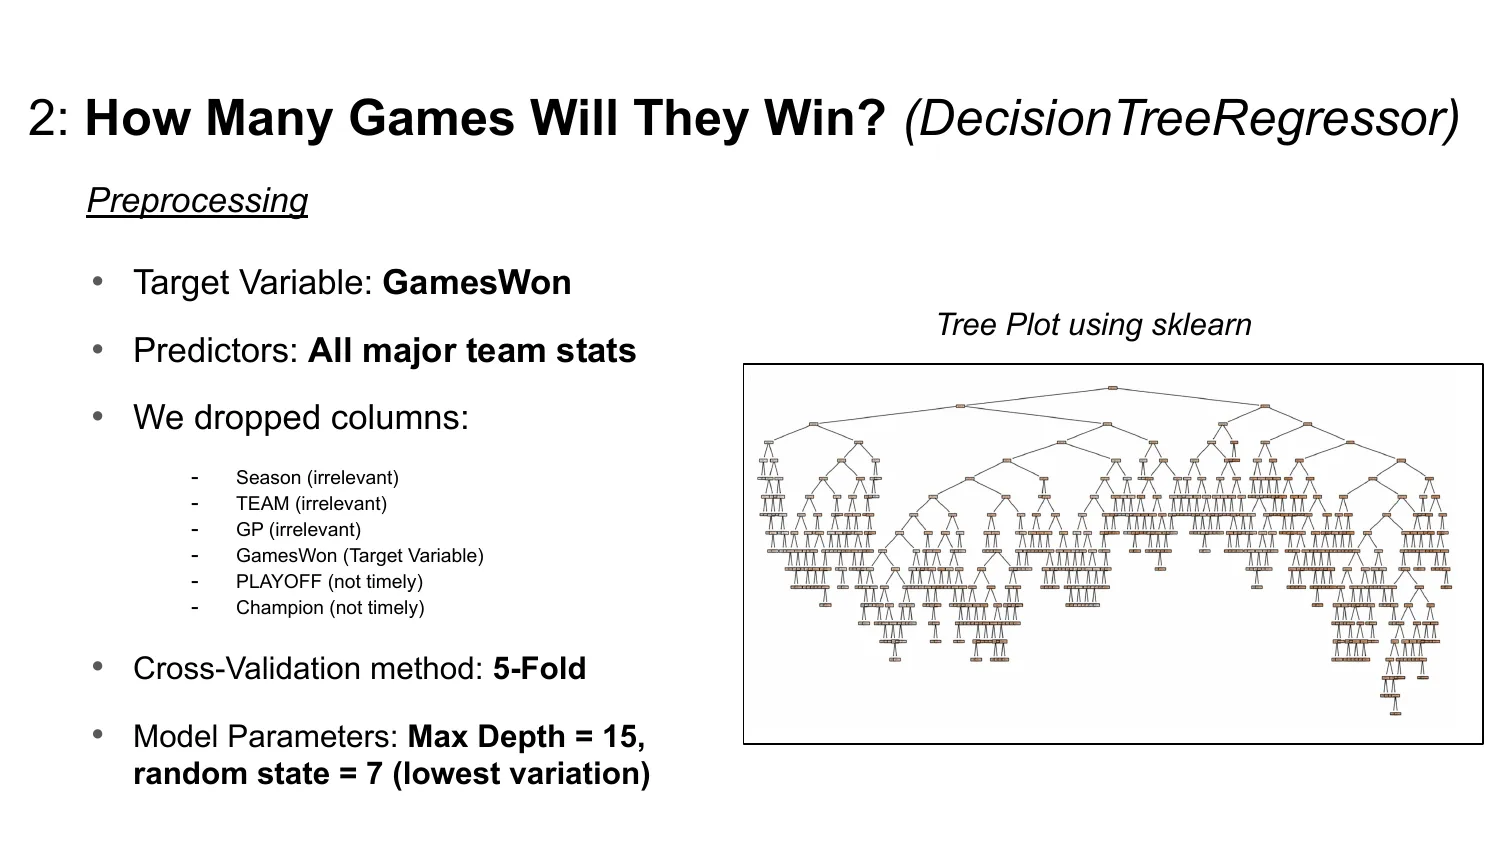
A decision tree regressor predicted season wins with a MAPE of 24.57%. It did well for elite teams (over 55 wins) and struggling teams (under 25 wins), but average teams were harder: their mix of strong and weak stats creates more uncertainty.
Picking a champion is hard, and 29% beats the odds
A linear support vector classifier reached 29% precision for picking the champion. That sounds low, but choosing one winner from 16 playoff teams at random would be right about 6% of the time.
What it means
The playoff model is a practical tool. The wins and championship models perform reasonably given the data, but not consistently enough for an NBA team or a betting company to rely on. Stats that don’t appear in a box score, like injuries and trades, matter.
Visuals
Tools and how I used them
Languages
- Python
- Data preparation, model training, and evaluation for all three models.
Analysis
- pandas
- Loaded the 540 team-season dataset and separated predictors from each target.
- scikit-learn
- Trained the random forest, decision tree, and support vector models; scored them with precision, F1, and MAPE; plotted the fitted tree.
AI used during development
- ChatGPT
- Helped enhance the championship (support vector) model.
Collaboration
- Google Colab
- Ran each model in its own shareable notebook, with the data stored in Google Drive.
How AI fits in
AI that helped me build it
The team used ChatGPT to help enhance the championship model, the support vector classifier. This is documented in the project's sources. The models themselves do not use AI at runtime; they are standard scikit-learn models.
Reflection
Limitations
- The wins and championship models are not consistent enough for a team or sportsbook to rely on.
- Injuries, trades, and coaching changes can swing a season, and none of them are in the data.