Marketing campaign · Operations · Data analysis
Print-on-Demand Apparel Store
I founded and managed a print-on-demand T-shirt business on Etsy from end to end. Along the way I focused marketing on the Auburn campus, built charts and maps to understand who was buying, and trained a model to predict whether an order would take more or less than a week to arrive.
What I did
- Founded and managed an end-to-end e-commerce operation selling T-shirts
- Ran targeted advertising on the Auburn campus to grow orders
- Built dashboards, pivot tables, charts, and heat maps to track sales and customers
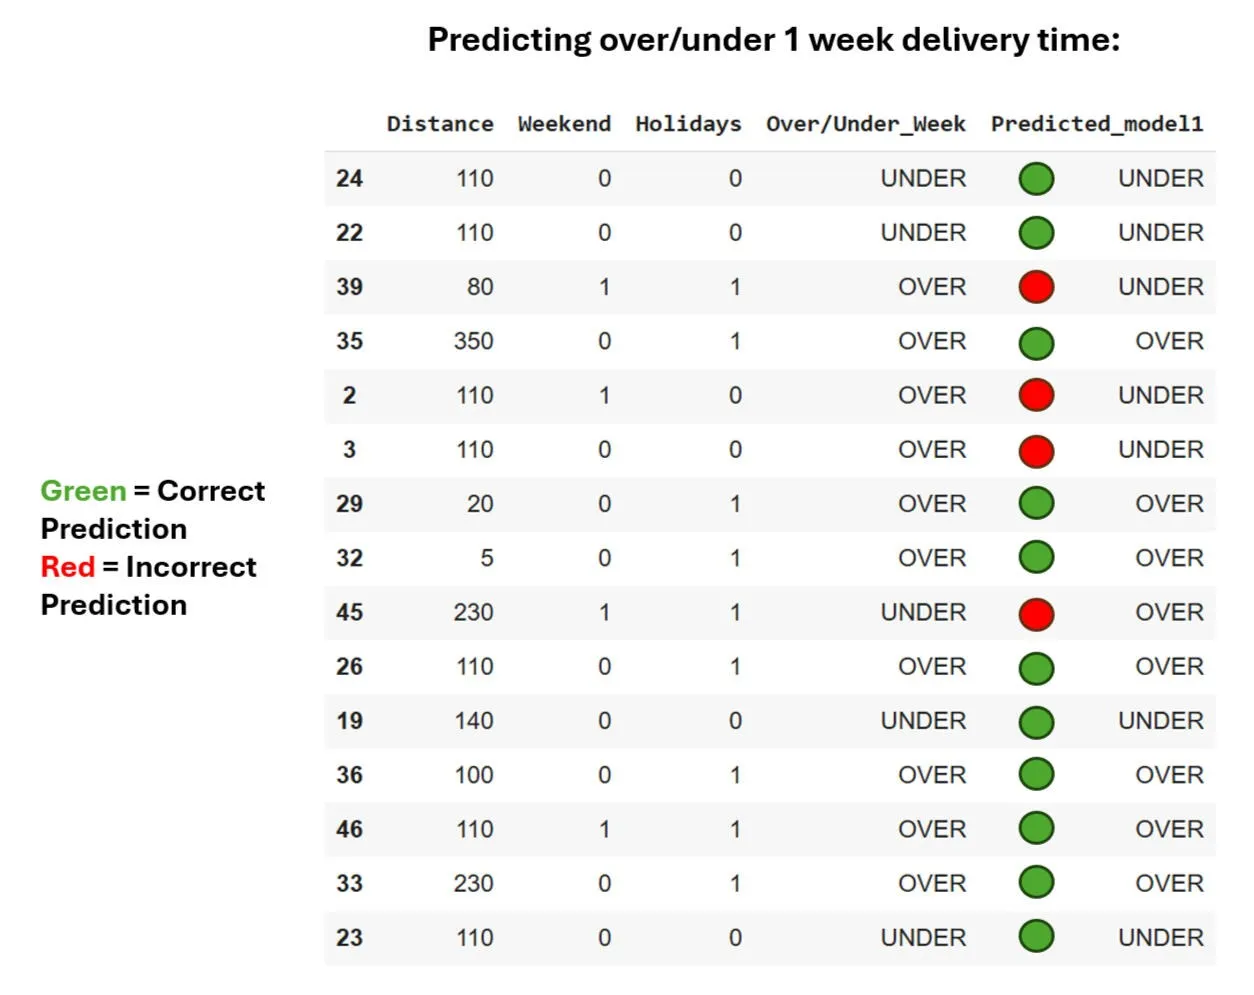
- Built a classification model to predict whether an order would arrive in more or less than one week
Results
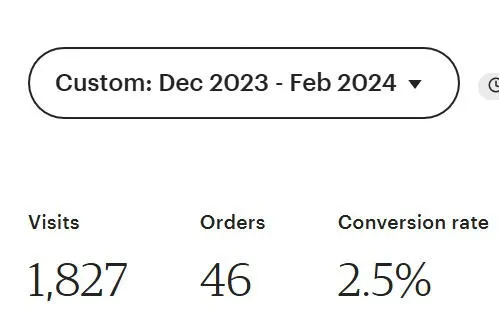
- 1,827 shop visits and 46 orders from December 2023 to February 2024, a 2.5% conversion rateShop analytics screenshot
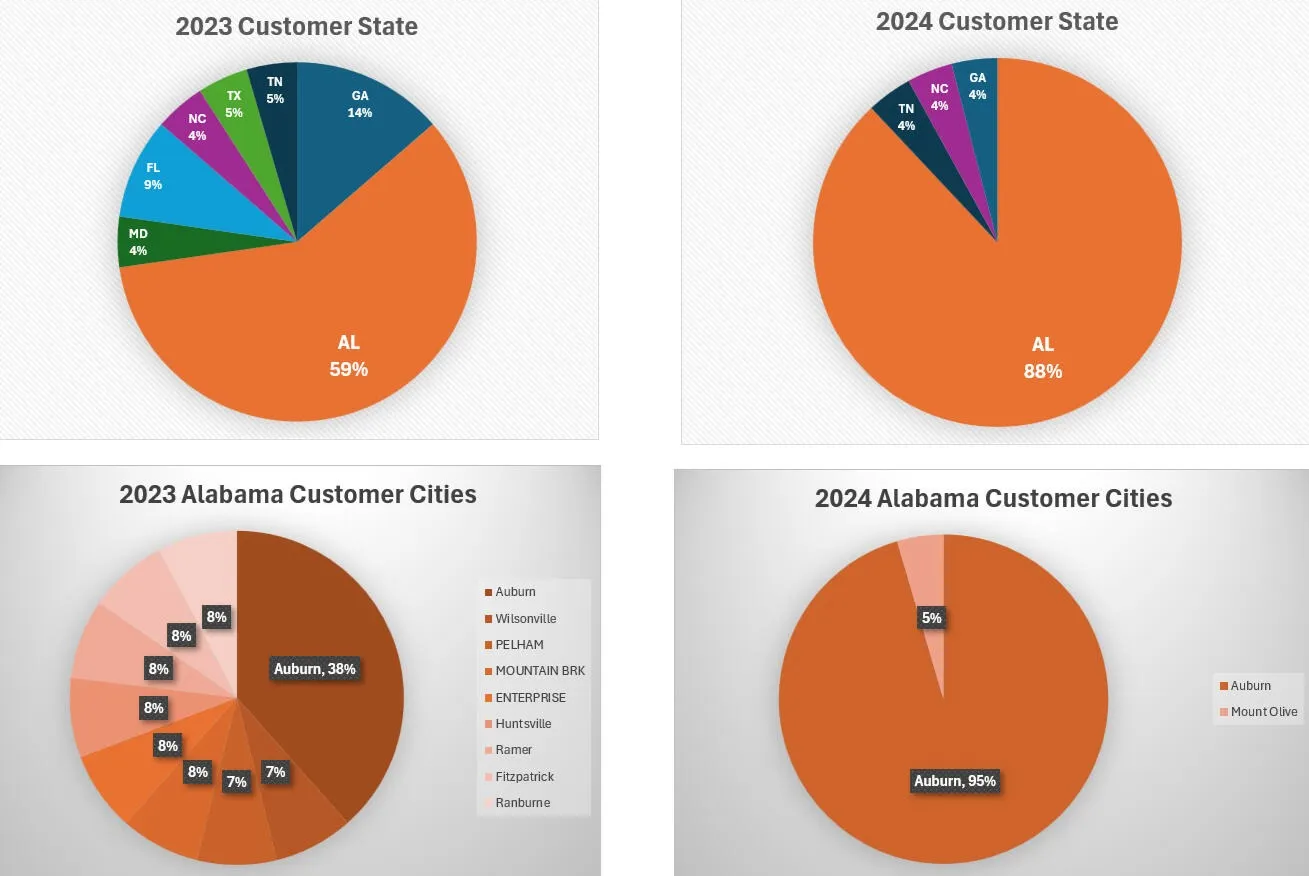
- Alabama grew from 59% of customers in 2023 to 88% in 2024, and Auburn from 38% to 95% of Alabama customersCustomer location charts built from order data
The business
I launched a print-on-demand T-shirt shop on Etsy: each shirt is printed and shipped only after it is ordered, so there is no inventory to buy up front. I ran the operation end to end, including the marketing and the numbers behind it.
Focusing on campus
I aimed my advertising at the Auburn campus, and the customer data shows how concentrated the business became. In 2023, 59% of customers were in Alabama. In 2024, 88% were, and Auburn alone made up 95% of Alabama customers, up from 38%.
Using my own data
- Dashboards and charts: pivot tables, charts, and heat maps to track sales and customers.
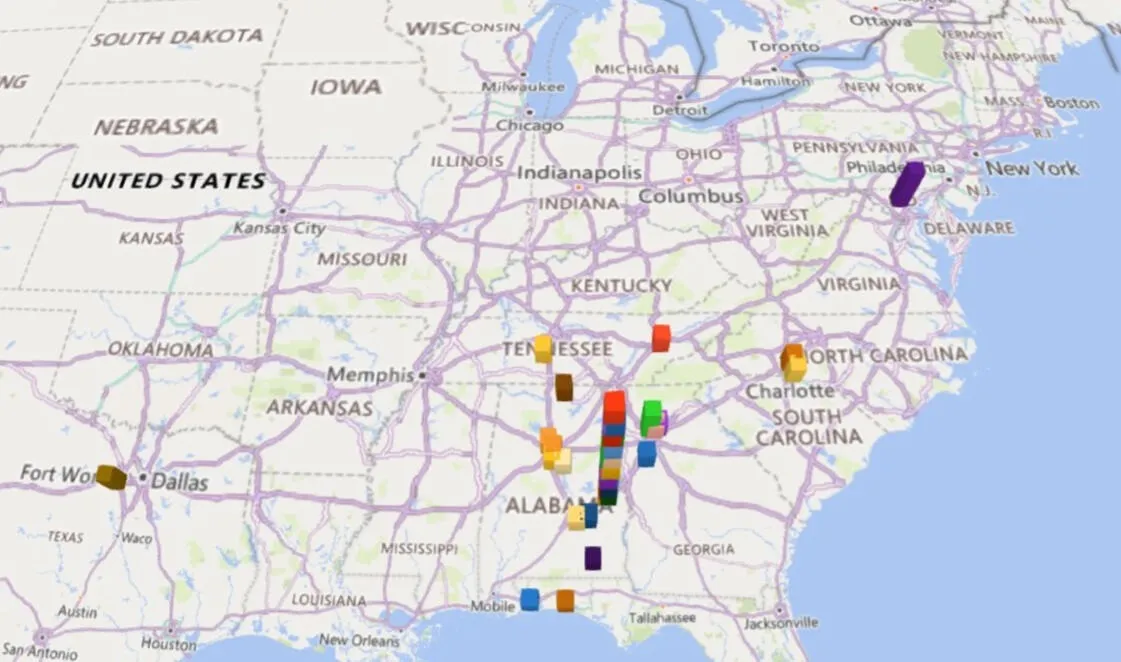
- Customer map: a geographic view of customer locations, which made the concentration in Alabama and the Southeast obvious.
- Delivery prediction: a classification model that predicts whether an order will take more or less than one week to arrive, based on shipping distance and whether the order falls on a weekend or holiday.
Visuals
Tools and how I used them
Marketing
- Etsy
- Storefront for listings, orders, and shop analytics.