Ai tool · Data analysis · Application
Tally: A Local AI Data Analyst for Spreadsheets
Many people have a spreadsheet and no idea where to start. Power BI and Excel take training, and AI chatbots can miscalculate, call random noise a trend, and require uploading sensitive data to someone else's servers. I set out to build a tool for complete beginners that is accurate first and simple second, then directed an AI coding assistant through the build and tested every version on my own Mac.
The problem
Business intelligence tools require you to learn the software, clean data by hand, and already know which columns are worth analyzing. AI chatbots can make arithmetic mistakes, describe random noise as a pattern, and send private data to a hosted service.
Audience: People with a spreadsheet and no analytics training, such as small-business owners, managers, and students
Objectives
- Accuracy above everything; never show a pattern that is not statistically backed
- Simple enough that no user ever feels overwhelmed
- Plain-English explanations with gentle ideas to try
- Private, free AI that runs on the user's own computer
Constraints
- No budget for hosted AI, so the model has to run on a personal laptop
- Small local models are weaker at math, so the design cannot depend on the model being right about numbers
What I did
- Wrote the product brief and the non-negotiables: analyze the whole file, show only statistically backed patterns, explain them so anyone understands at a glance, keep data private with a local AI model, and install with a double-click
- Directed an AI coding assistant (Claude Code) through 10 reviewed pull requests in one week, making every product, design, and model decision
- Chose the default AI model (qwen3.5:9b) after comparing it with gpt-oss:20b for a 24 GB Mac
- Installed and used the app on my own Mac, and turned problems I found (vague explanations, a glitchy loading screen, stale versions after updates) into specific fixes
- Required an AI self-review that rereads every chart and explanation for clarity, and commissioned research on how people read charts that the AI follows on every call
- Set up a shared vision log so Claude Code and OpenAI Codex follow the same product direction
Results
- Random data produces zero findings, checked on 5 random datasets of 600 rows eachAutomated pure-noise test, run October 30, 2026
- On a 5,285-row test dataset with patterns planted on purpose, Tally found the planted patterns and ignored the two pure-noise columns (58 checks run, 18 passed, 7 shown)Sample analysis and engine tests on synthetic data, October 30, 2026
- All 40 automated tests passTest suite run, October 30, 2026
- A working prototype (version 0.1.0) installed and used on my own Mac, with PDF, PNG, and interactive HTML exports
The problem
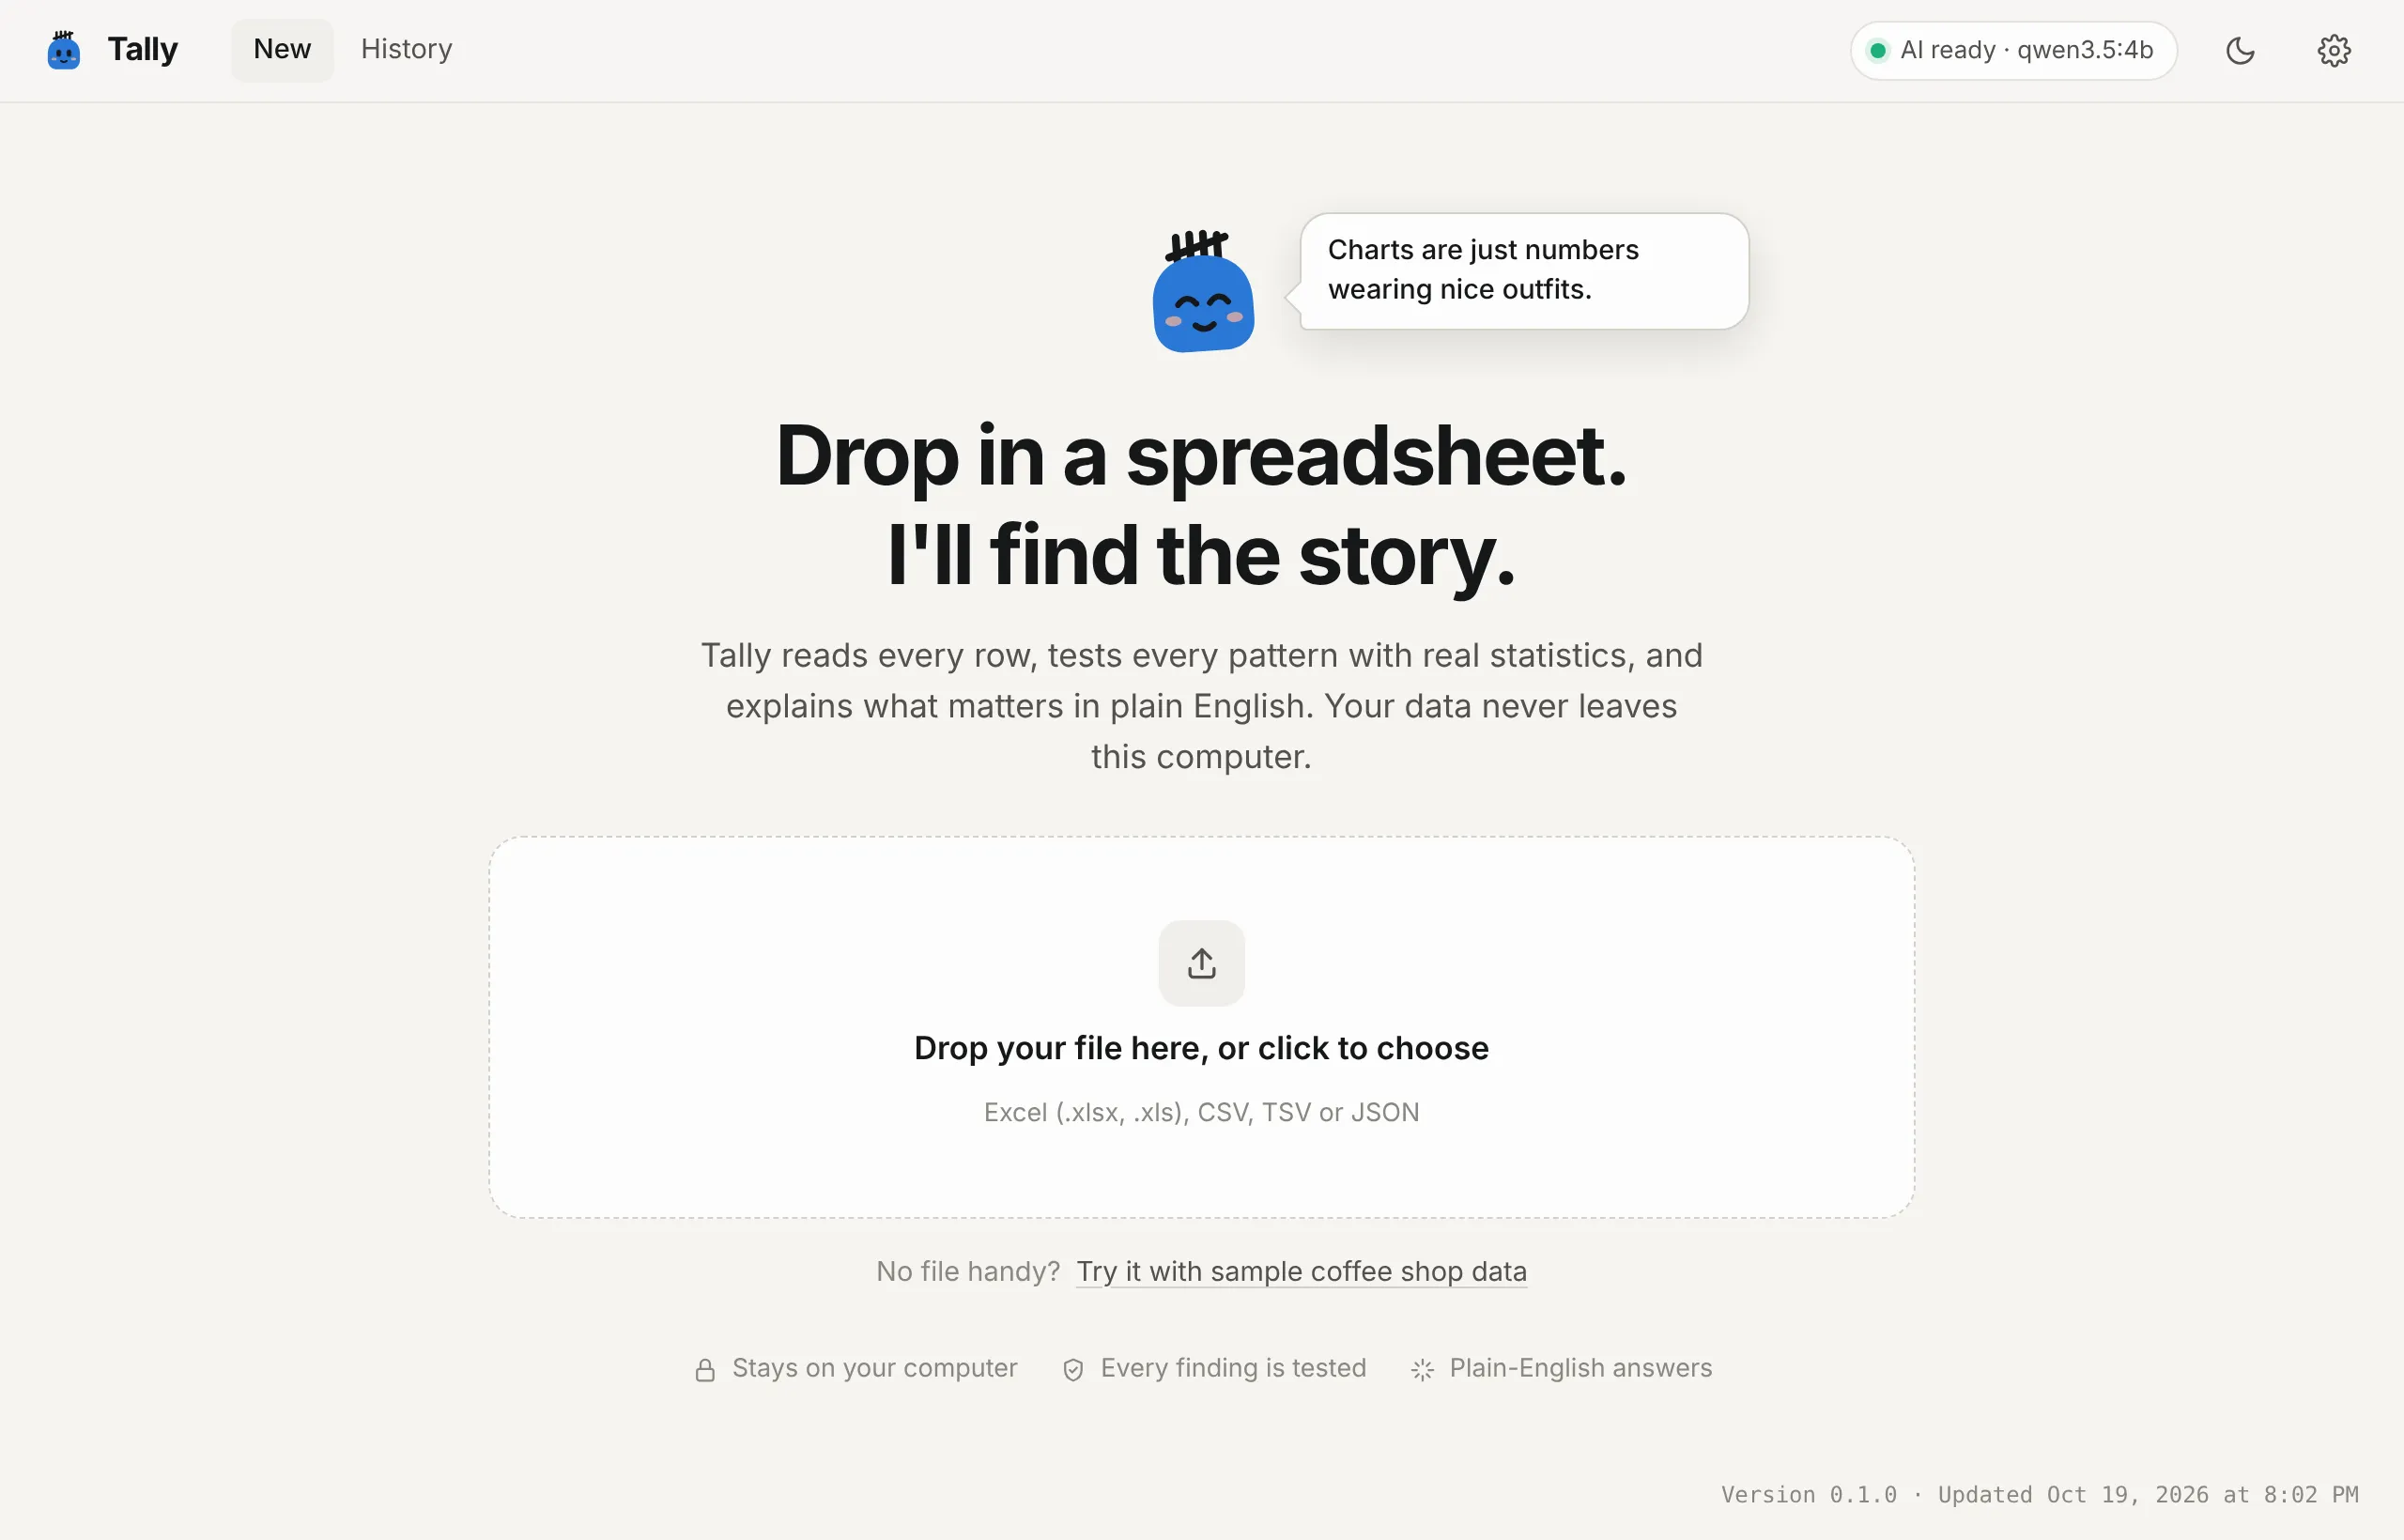
Tools like Power BI are powerful, but you have to learn the software, clean the data by hand, and already know which columns are worth looking at. I wanted someone who has never analyzed data to drop in a spreadsheet and get back something they can understand and present.
My rules were simple: accuracy above everything, no user should ever feel overwhelmed, and private data stays private.
Why not just ask ChatGPT?
It is a fair question, and it shaped the whole design. Tally does three things a general chatbot does not:
- Your data never leaves your computer. Tally’s AI model runs locally through Ollama, so a spreadsheet of customer lists, sales, finances, or employee records is never sent to a public AI service. For sensitive or confidential data, that is the difference between being able to use AI at all and not.
- The numbers are checked, not guessed. A chatbot does the math itself and can get it wrong or treat noise as a trend. In Tally, real statistical tests decide what is true, and the AI is not allowed to change or add a single number.
- A story you can present, not a wall of text. Findings come back as short chapters with clear charts, and “Play the story” replays them as full-screen slides, like Spotify Wrapped for your data. Reports export to PDF, PNG, or an interactive web page to share.
The key decision: statistics do the math, AI writes the words
Tally never lets the AI decide what is true. A Python statistics engine cleans the file and runs dozens of real hypothesis tests: trends over time, differences between groups, numbers that move together, unusual values, and more. Testing that many combinations will turn up some “significant” results by luck, so every result is adjusted with a false-discovery-rate correction and must also clear a minimum effect size before it can appear.
Only then does the local AI model get involved. It receives the proven facts for each finding and rewrites them in plain English, under four guardrails:
- A number filter. Any sentence containing a number the model was not given is thrown out, and Tally keeps its own template wording.
- Structured output. Every response must match a fixed format: title, headline, explanation, ideas.
- A self-review. After writing, the model rereads each chapter as a first-time reader and fixes anything that is not instantly clear. The questions it asks itself come straight from my request.
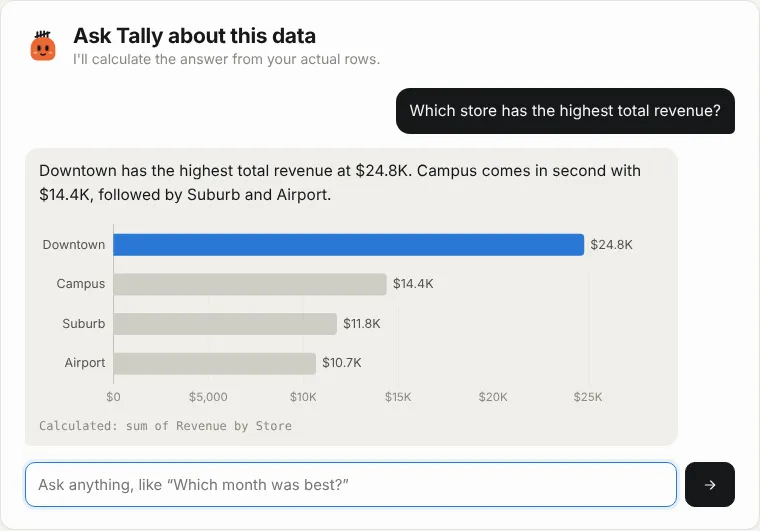
- Calculator tools for chat. When a user asks a question, the model has to call tools that compute the answer from the real rows. Answers with numbers the tools did not produce are rejected.
How a spreadsheet becomes a story
- Drop in a file. CSV or Excel, including messy files with title rows, “Total” rows, currency symbols, or mixed date formats. Tally cleans them and lists every change it made in plain English.
- Watch it work. A progress screen walks through six steps, from reading the file to double-checking that the wording is easy to read.
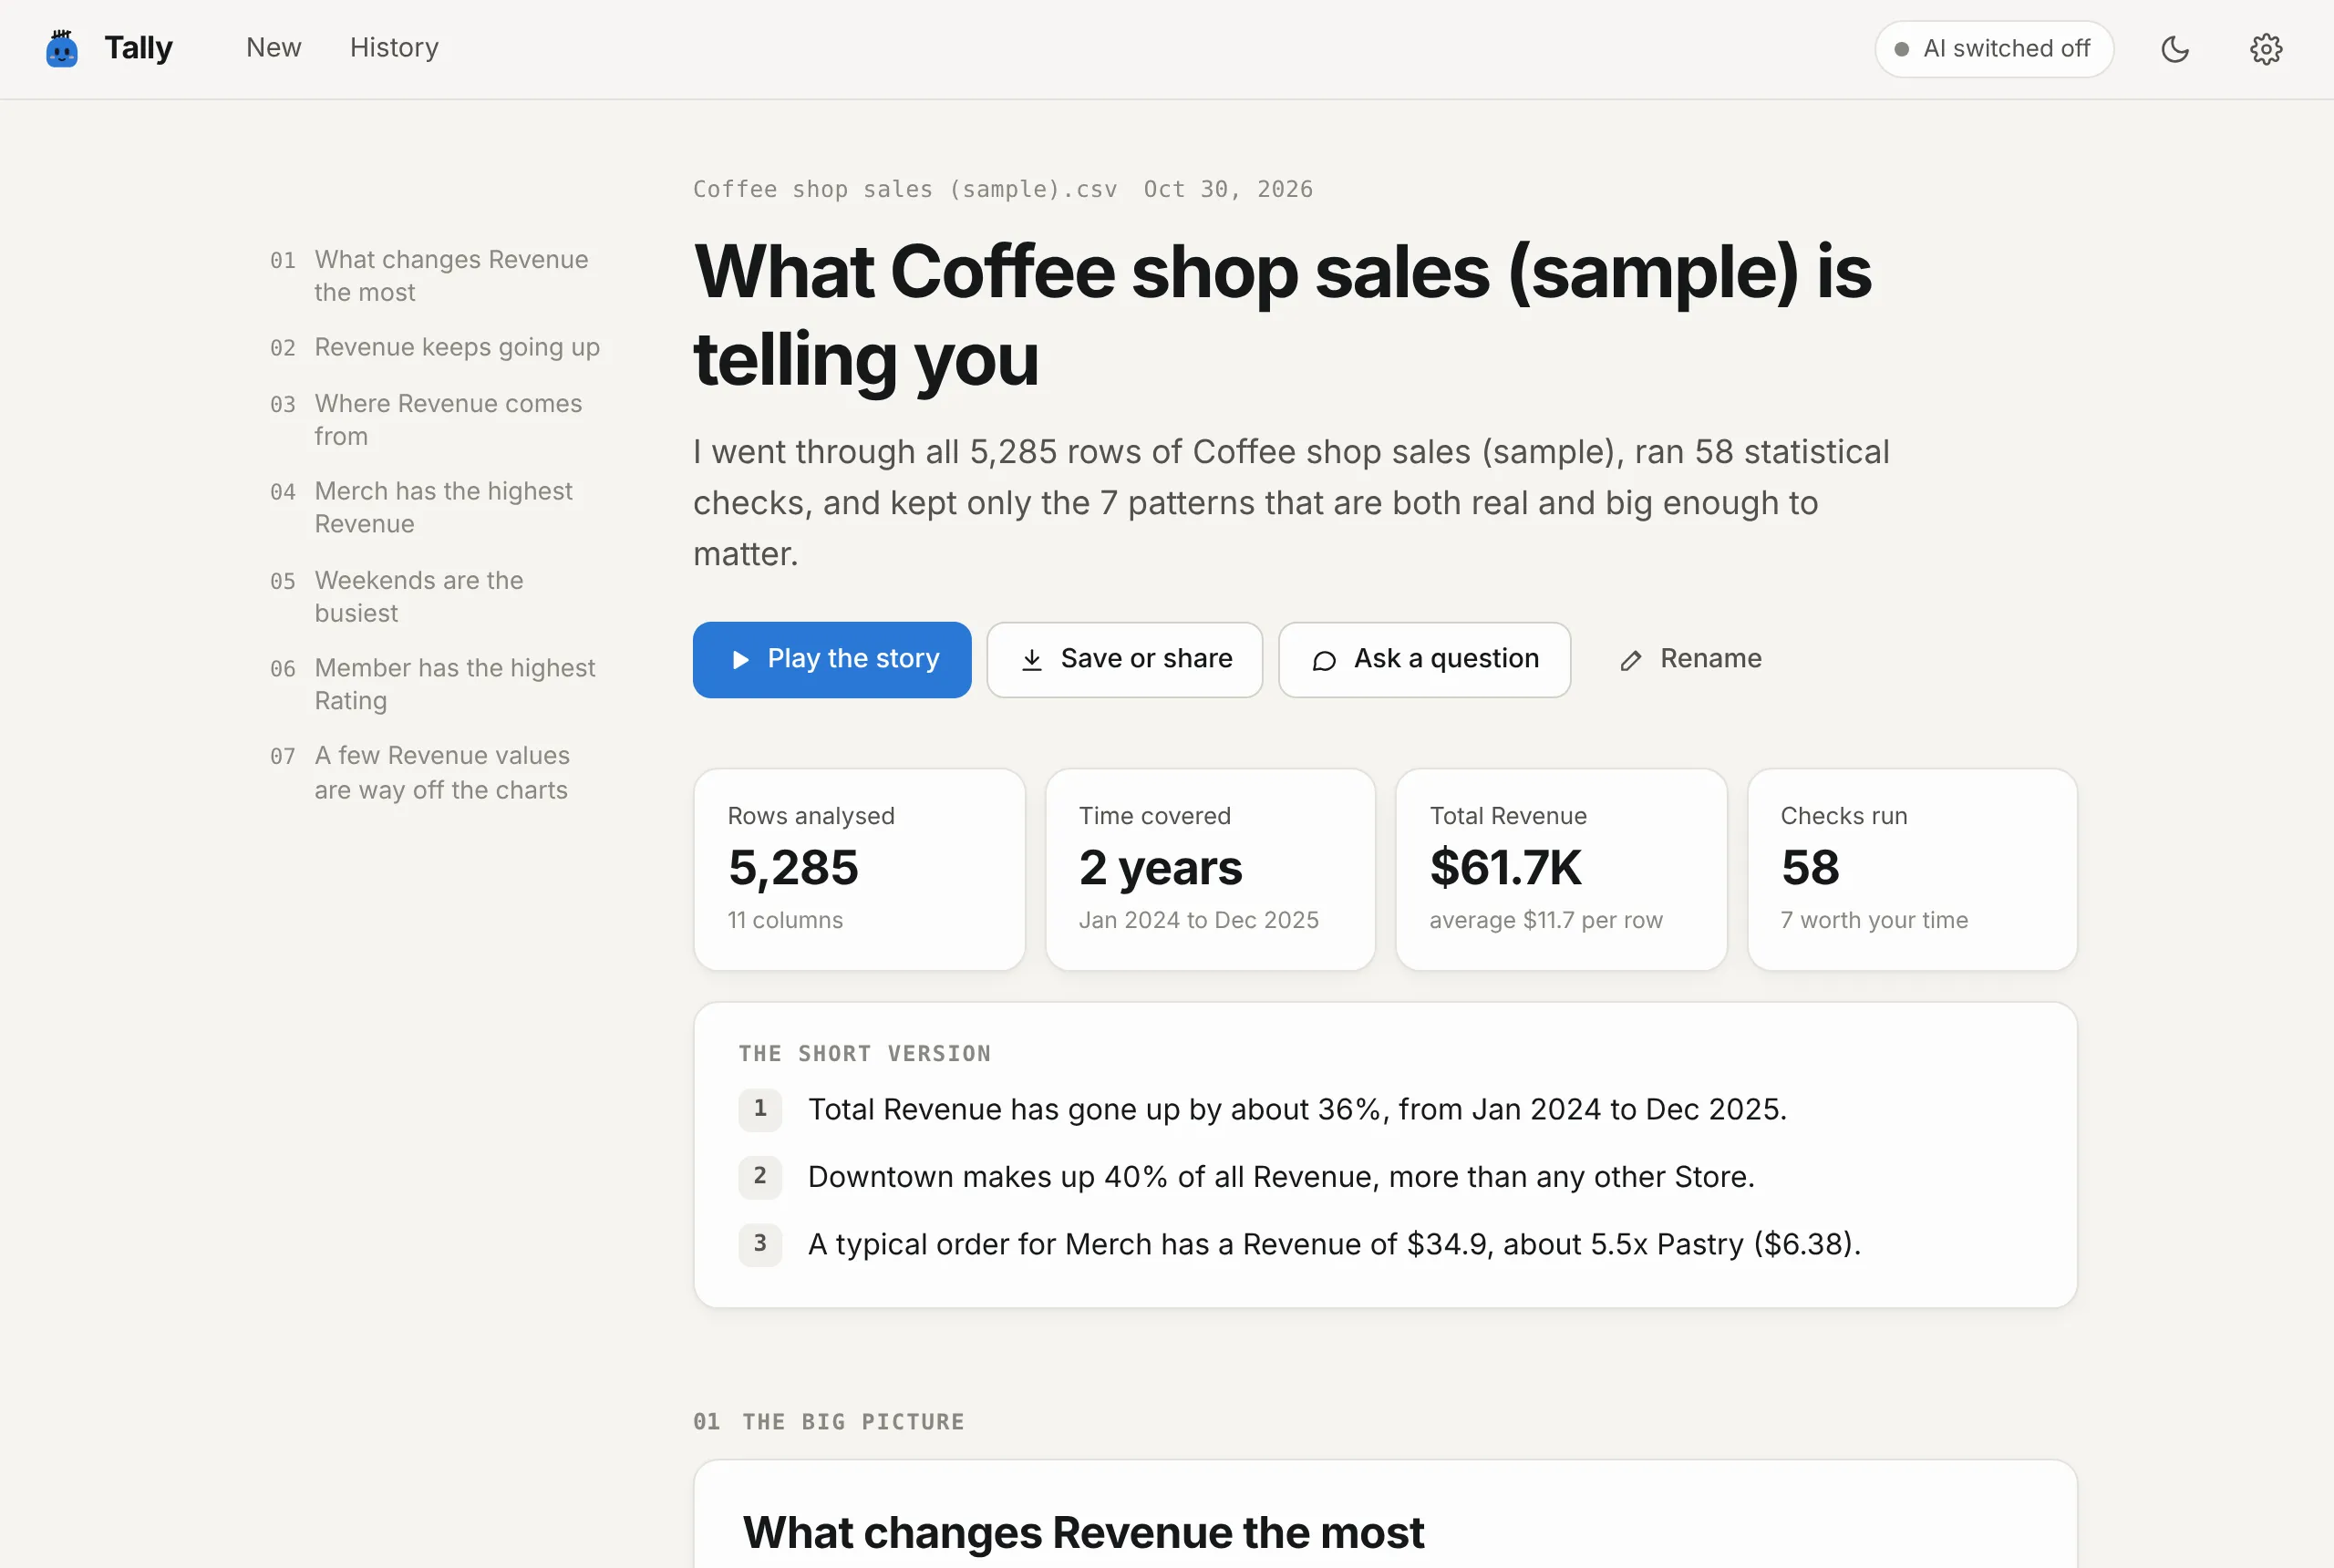
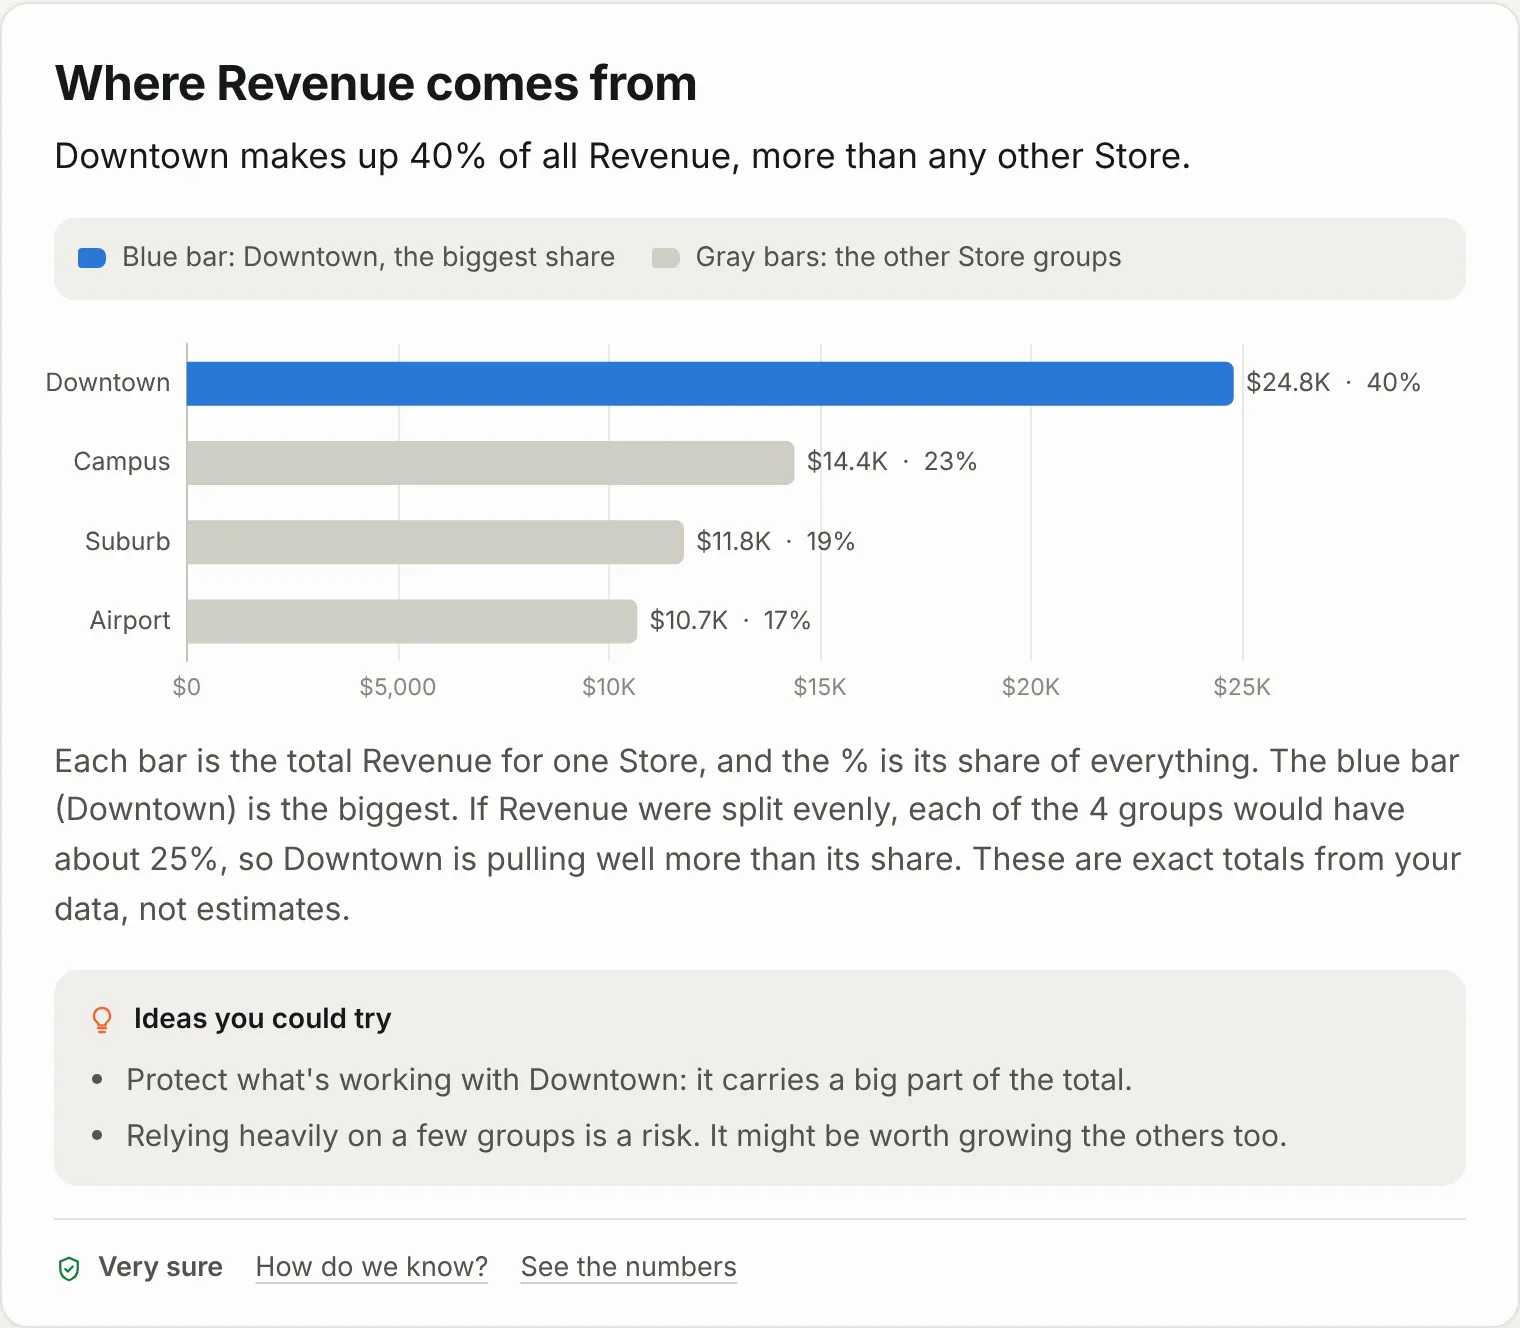
- Read the story. Up to seven short chapters, each with a takeaway title, a color key, an interactive chart, a short explanation, ideas to try, and a confidence label like “Very sure.”
- Go further. Ask questions, replay the findings as slides, or export a PDF, PNG, or interactive web file. Every report is saved in History.
Testing it against a known answer
To check that Tally finds real patterns and ignores fake ones, the project includes a synthetic dataset of 5,285 coffee-shop orders with five patterns planted on purpose and two columns of pure noise.
| Planted in the data | What Tally reported |
|---|---|
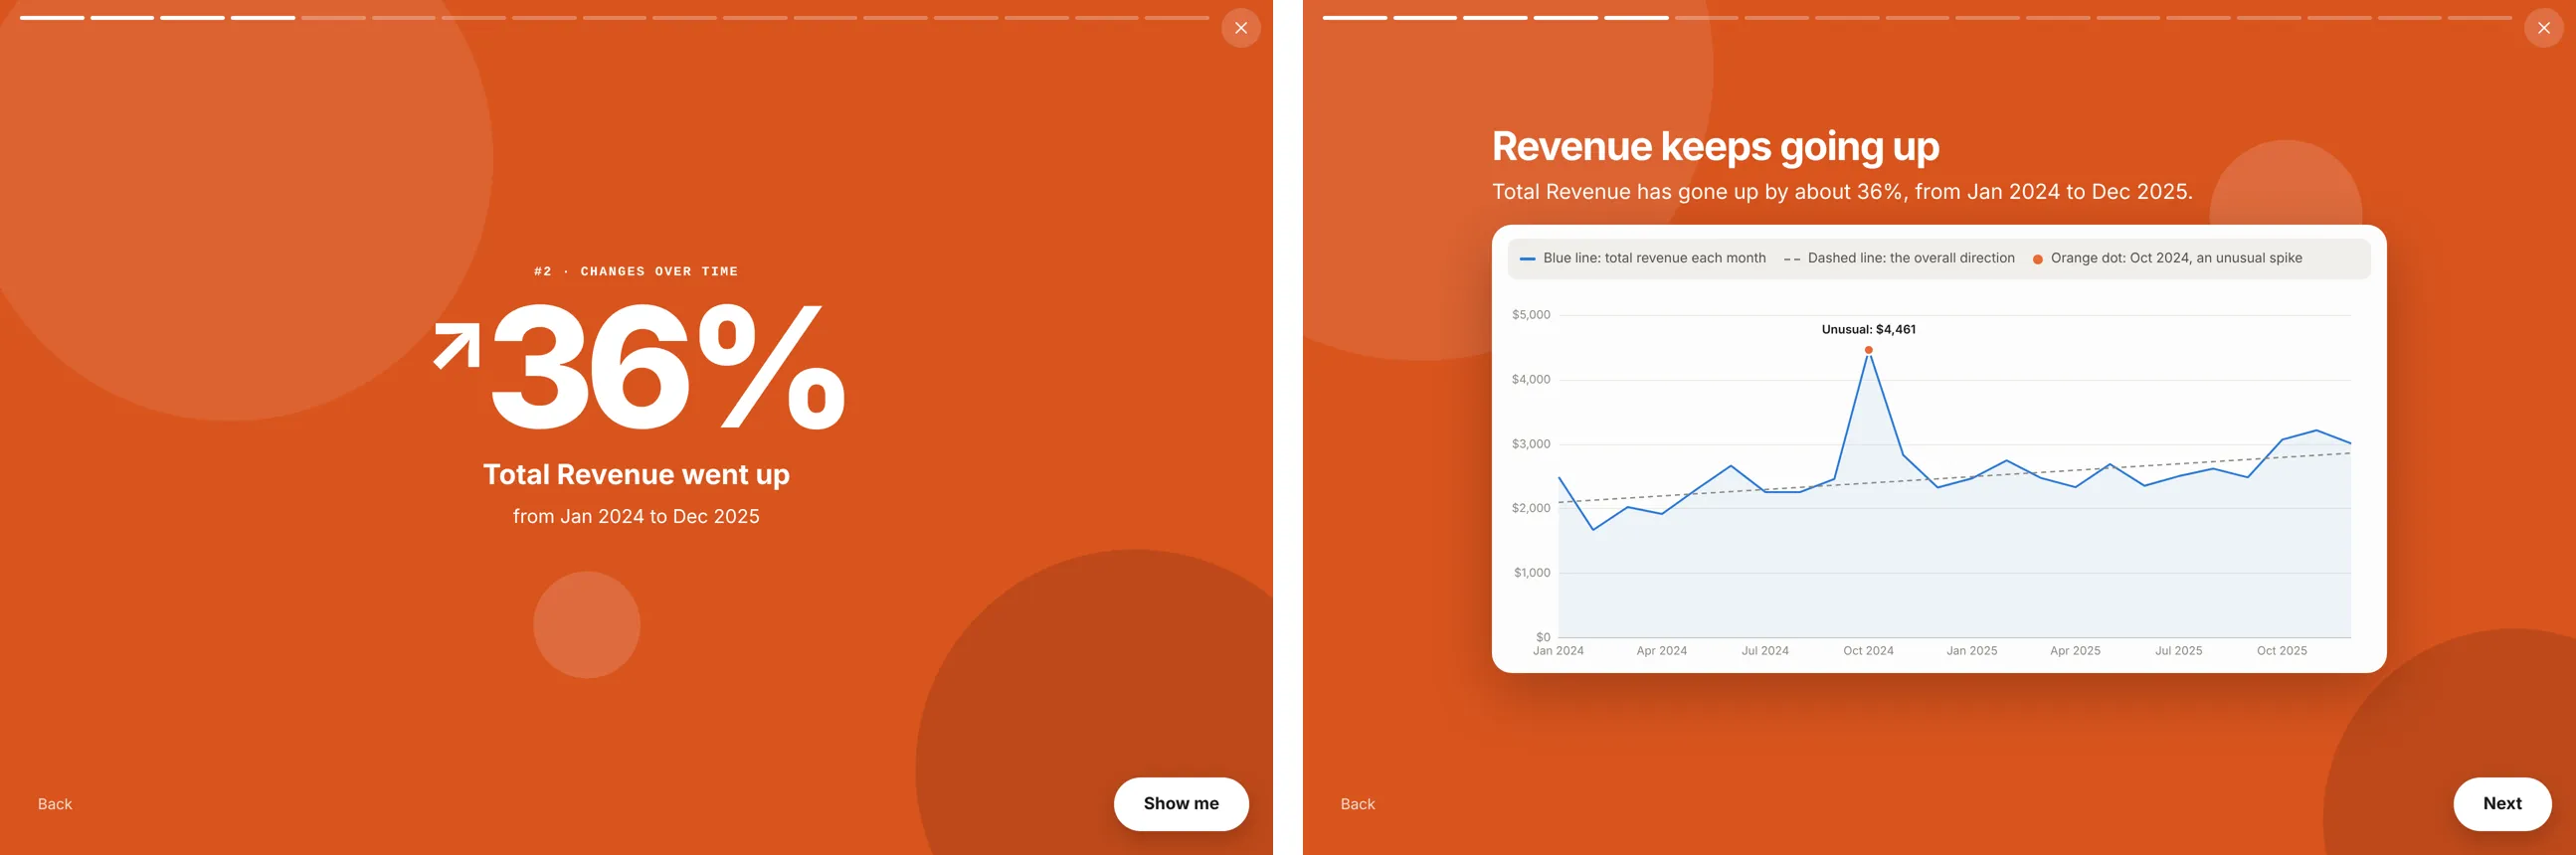
| Sales grow over two years | Revenue up about 36% from January 2024 to December 2025 |
| Weekends are busier | Sundays bring in about 1.9x the revenue of Wednesdays |
| Members rate higher | Members average 4.31 versus 3.91 for walk-in customers |
| Four huge catering orders in October 2024 | Flagged as an unusual month and as unusual values |
| Payment method and barista are random | Not reported |
Tally also noticed that revenue equals quantity times price and deliberately skipped that obvious link. The most important test runs the other direction: five datasets of pure random numbers must produce zero findings, and they do.
Directing an AI-assisted build
I did not write Tally’s code by hand. I wrote the product brief, set the rules, and directed Claude Code through 10 rounds of building and review in one week. Because I switch between Claude Code and OpenAI Codex, I had the project keep a written vision and decision log that both tools read first, so neither drifts from the product direction.
The most useful changes came from using the app myself:
- “It just mentions variables without interpreting them.” The first AI explanations named columns without saying what they meant. The fix gave the model each chart’s color key and a description of the spreadsheet, required a three-sentence structure, and added a bad-versus-good example.
- A glitchy loading screen. The step list was being rebuilt twice a second. It now updates in place, with a smooth 0 to 100% counter that never moves backward.
- Still showing the old version after an update. An older copy was still running in the background. New copies now detect and replace it, and the home screen shows the installed version and when it was published.
Visuals
Tools and how I used them
Languages
- Python
- Language for the statistics engine and the local server.
Analysis
- pandas
- Reads, cleans, and reshapes uploaded spreadsheets.
- SciPy
- Runs the hypothesis tests behind every finding.
Visualization and reporting
- Apache ECharts
- Draws the interactive chart in each report chapter.
APIs and integrations
- FastAPI
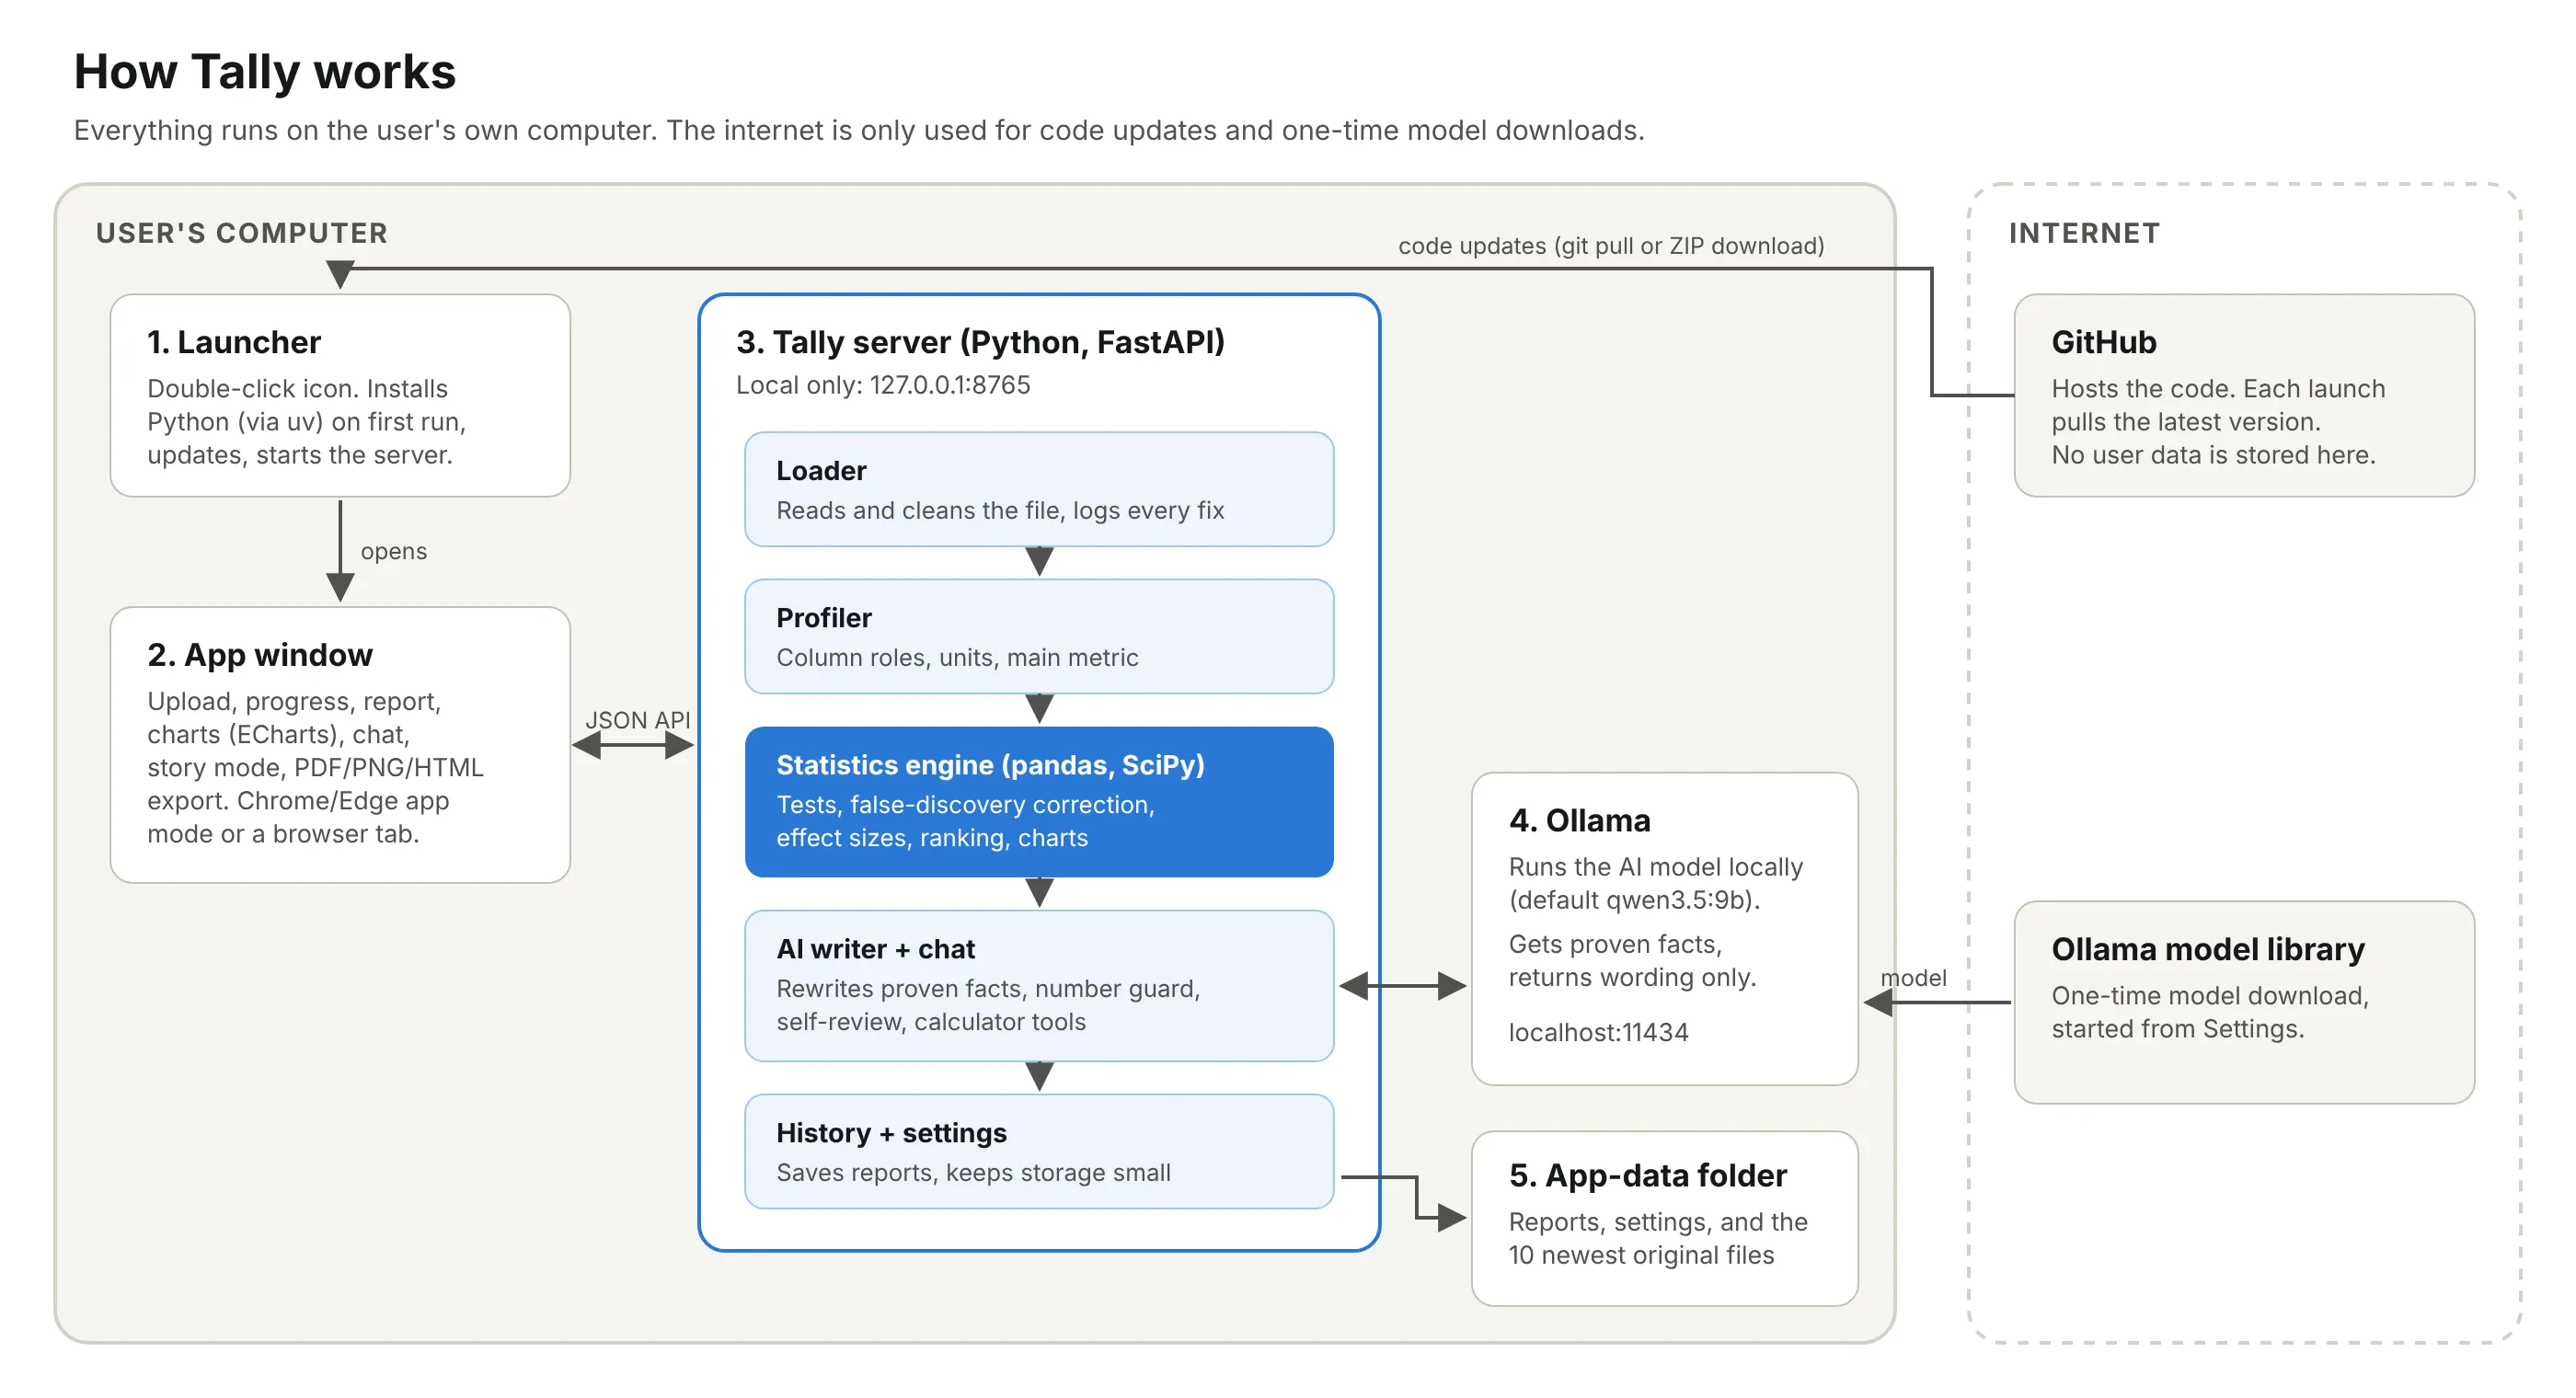
- Local server that connects the app window to the analysis engine and the AI model.
Source code and version control
- GitHub
- Pull request reviews, and the source installed copies pull updates from on every launch.
AI inside the project
- Ollama
- Runs Tally's AI model on the user's own computer, with no per-use cost and no data leaving the machine.
- Qwen 3.5 (qwen3.5:9b)
- The default model I chose; it rewrites proven findings in plain English and answers chat questions through calculator tools.
AI used during development
- Claude Code
- Wrote the code, tests, installers, and documentation from my requirements and feedback, through 10 reviewed pull requests.
How AI fits in
AI that helped me build it
I directed Claude Code, an AI coding assistant, to build Tally. It wrote essentially all of the code, tests, installers, documentation, and the research guide, based on my requirements and feedback. I decided the product's goals, audience, design, model choice, and which features to build, and I tested each version myself. Claude does not run inside Tally.
AI inside the finished project
A local open-weight model, run through Ollama on the user's computer, writes the report in plain English and answers questions. It never calculates statistics, decides which findings are real, or supplies numbers. Python does all the math; the model only gets proven facts and returns structured text. A filter rejects any sentence containing a number the model was not given, a self-review pass rewrites anything unclear, and chat answers must come from calculator tools that run on the real rows.
- Privacy
- Uploaded files and reports never leave the user's computer; the internet is only used for app updates and one-time model downloads.
- Cost
- No per-use AI cost, because the model runs locally instead of through a paid API.
- Quality
- Small local models are weaker than hosted ones and can still overstate in words, so numbers come from Python and a number filter blocks invented figures.
- Performance
- Writing is slow without a capable GPU (40 to 115 seconds per AI call on a CPU-only test machine), and the self-review roughly doubles AI time.
- Reliability
- If the model is unavailable or returns unusable output, Tally falls back to its own template wording, so charts and statistics always work.
Reflection
What I learned
- Use AI where it is strong, which is language, and code where accuracy is required.
- A model's output depends heavily on the context it is given. Adding the chart's color key and a description of each column did more for clarity than rewording the prompt.
- A monitoring signal has to measure the thing you care about. The version stamp first showed when the app started, not which version was installed.
Limitations
- Tested on synthetic data with known answers; no other users have tried it yet.
- Small local models can still overstate in words, which the number filter cannot catch.
- The Windows installer is written but has not been tested on a real Windows PC.
What I would improve
- Run a short usability study with non-technical readers to measure whether each chapter is understood within five seconds.
- Test and sign the Mac and Windows apps so they install without security warnings.
- Let users compare two files, such as this month and last month.